 Miravo
Factory
The Console's home page: what is running, how to connect to it, and where it is sent. Overview, Assets, and Integrations tabs.
Factory is the Console's home page. It shows the whole factory, each template loaded into it, and what has been sent to Litmus Edge.
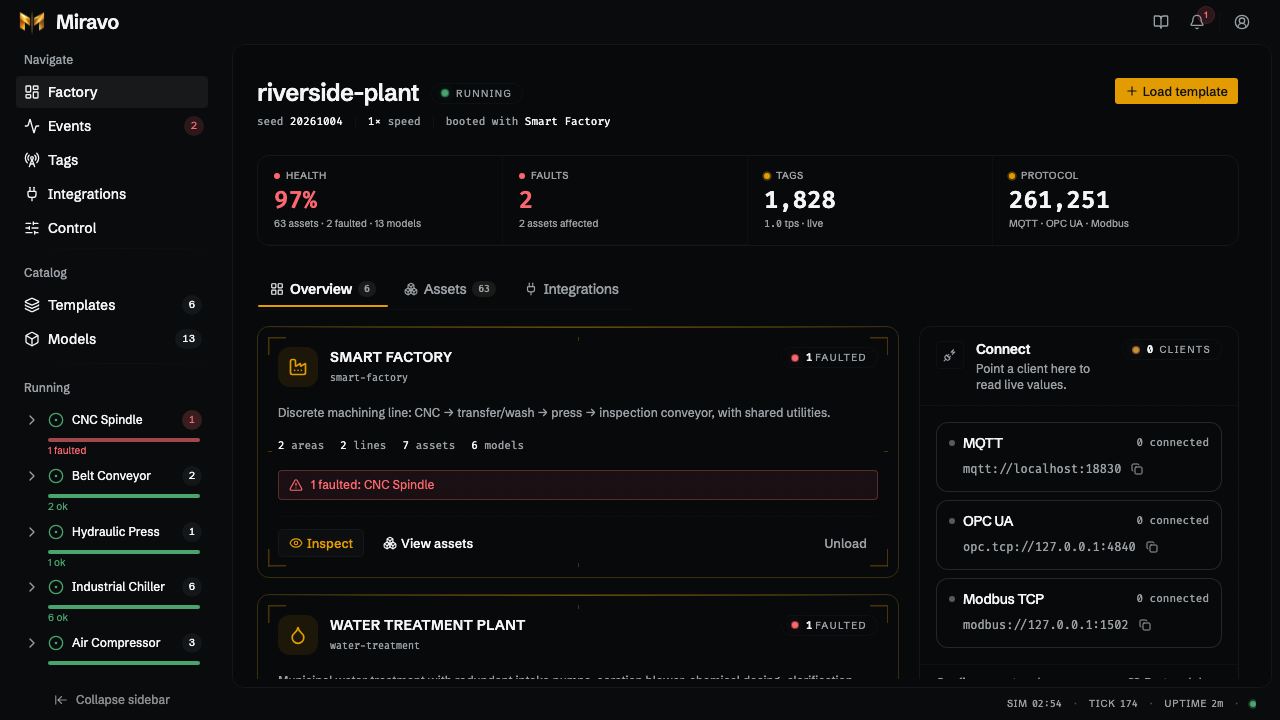
The header shows the factory name, engine state, seed, speed, and the boot template. Load template opens the catalog. Below it, a status strip shows health, faults, tags, and the enabled protocols. Three tabs follow: Overview, Assets, and Integrations.
Overview
- Template cards: one per running template, in a grid that fills the width. Each card shows the template name and id, a status pill (running, paused, or N faulted), the catalog description, and counts of areas, lines, assets, and models. When assets are faulted, a red line names the affected models and links to those assets.
- Standalone assets: assets spawned directly from a model, which no template owns. They show as chips that link to the asset page. The card lists the first 24; +N more lists the rest. Spawn asset opens Models.
- Connect: one row per protocol that is serving (MQTT, OPC UA, Modbus TCP), with its endpoint, a copy button, and the number of connected clients. Protocols that are off are listed below. Configure protocols opens Control.
- Integrations: one row per integration. Litmus Edge shows its targets, applied, and failed counts. The others are listed as coming soon. Click a row to open the Integrations tab.
On a narrow screen, Connect and Integrations stack below the template cards. An empty factory shows an Open catalog button instead of cards.
Template card actions
- Inspect opens the template's sheet with four tabs: Live, Overview, UNS, and Export.
- View assets opens the Assets tab filtered to that template.
- Unload asks for confirmation, then removes the template's assets. Standalone assets stay. To load it again, launch it from the catalog.
The Live tab
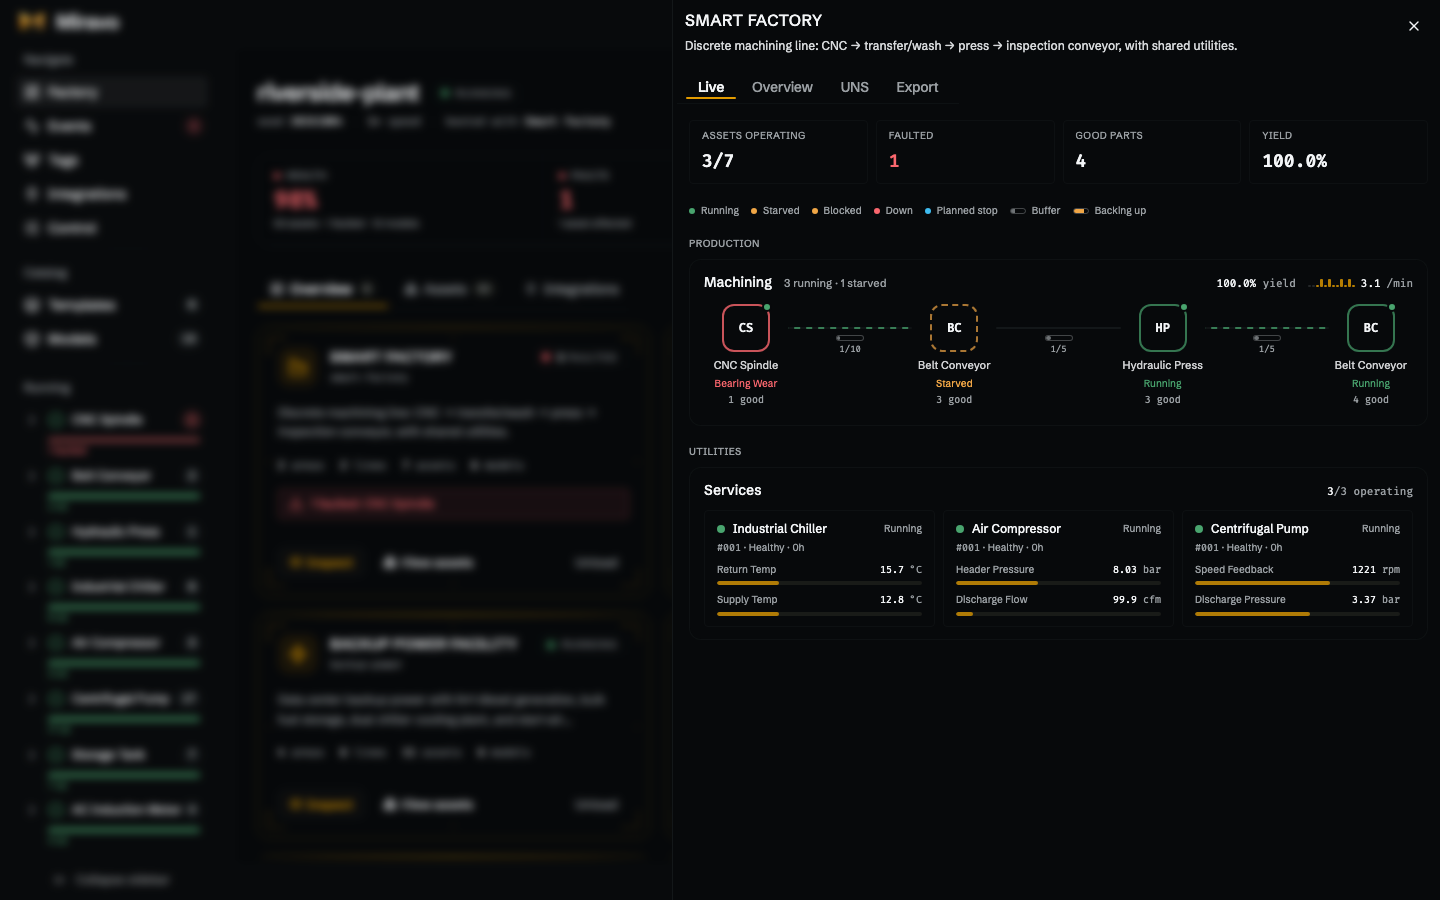
Live opens first. It works for every template. The top row shows how many assets are operating, how many are faulted, and, depending on the template, good parts and yield (station lines) or the number of lines (process templates). Then each area lists its lines:
- Station lines (see production lines) are drawn as a flow of stations joined by conveyors. Each station shows its state, such as running, planned stop, or off shift. Buffer gauges show how full each buffer is, and a bottleneck badge marks the station that a nearly full buffer feeds. Each line also shows its yield and a trend of good parts per minute over the last two minutes.
- Process lines show each asset as a tile with its run state, lifecycle stage, operating time, and live gauges of its headline measurements.
Assets
Every running asset, filterable by template and status. See Assets. The old /assets address redirects here.
Integrations
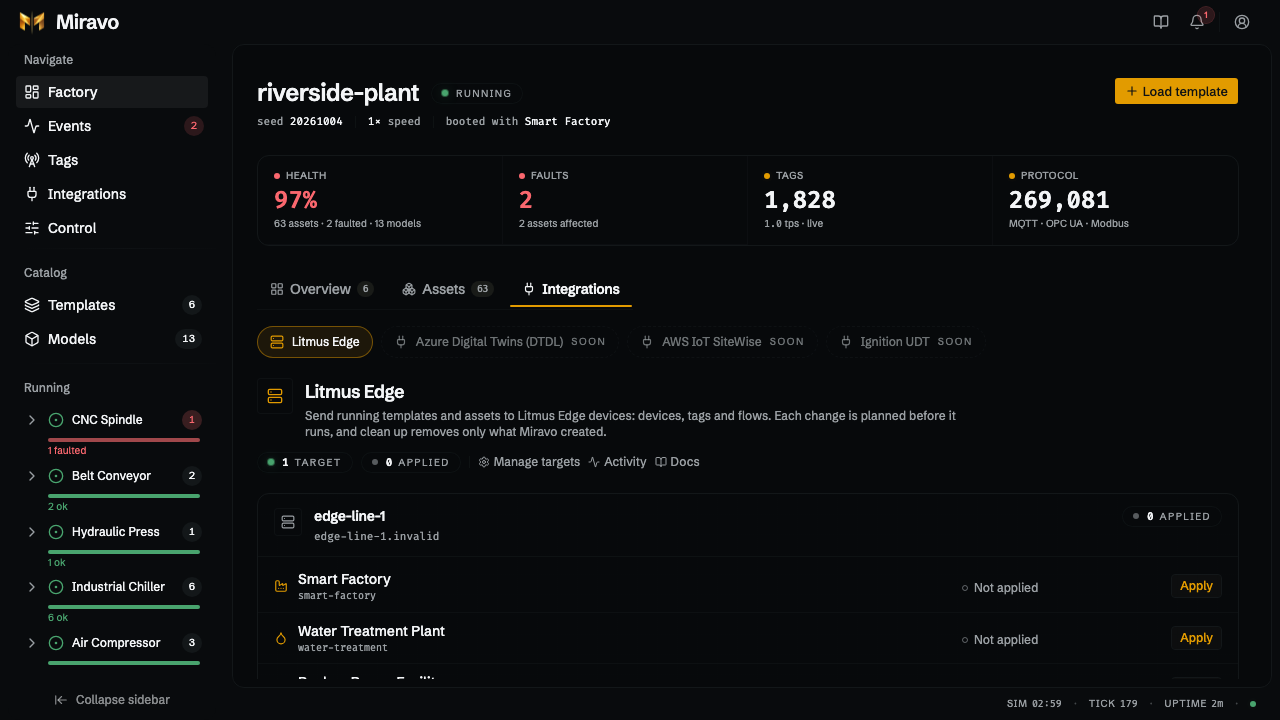
Pick an integration at the top. Litmus Edge is available; the others show Soon. This is where you send the factory to Litmus Edge and clean it up again. See Send to Litmus Edge.
Assets
Every running asset and its health.
Templates and Models
Launch a template or spawn a model.
Integrations
Send the factory to Litmus Edge.
Was this page useful?
Last updated on
Common workflows
The Console workflows most people use: launch a template, watch an asset, trigger a fault, find a tag's address, change speed, and push a factory to Litmus Edge.
Assets
The Assets tab on Factory: every running asset and its health, filtered by template or status, then one asset opened to follow its live values.