Console
Monitor a running Miravo environment, inspect assets, export tags, manage platform targets, and control runtime adapters from the browser.
The Miravo Console runs on the admin HTTP server. It reads the same runtime snapshot, event stream, catalog, and platform APIs used by the CLI.
Open the Console from the admin server:
http://127.0.0.1:8080During local Console development, use the Vite URL:
http://localhost:5173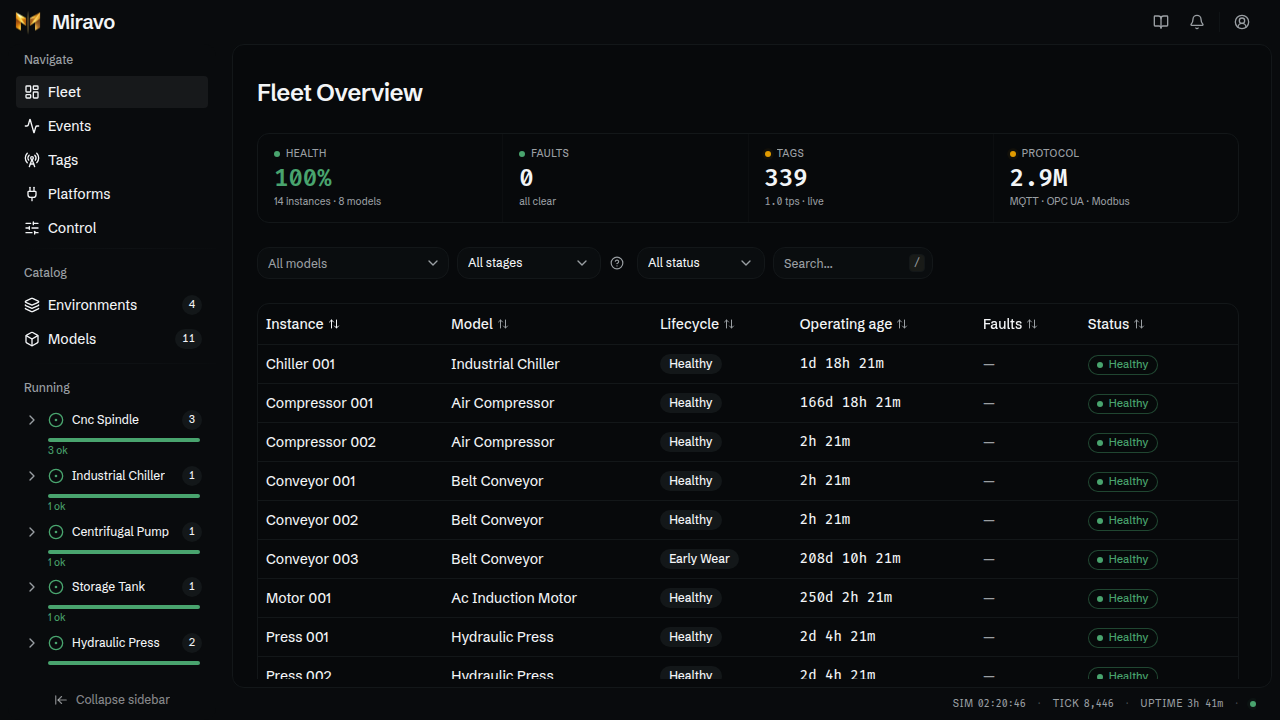
Access
The Console requires login unless the admin server runs with --no-auth.
Default credentials:
| Field | Value |
|---|---|
| Username | admin |
| Password | admin |
The first login with the default password asks for a replacement password. Changed passwords persist in ~/.miravo/auth.json.
Set an admin password from the environment:
MIRAVO_ADMIN_PASSWORD=my-password miravo startWhen MIRAVO_ADMIN_PASSWORD is set, it controls the admin password. Change the variable and restart Miravo to rotate it.
Routes
Console tasks
Launch environments, export tags, inject faults, and apply platform targets.
Fleet
Inspect live health, sort instances, and open an instance detail page.
Events
Read the chronological runtime log and use the alerts inbox.
Tags
Filter the live tag manifest and export CSV or platform-ready tag lists.
Catalog
Browse environments and asset models. Launch, spawn, inspect, and export content.
Control
Pause the engine, change speed, manage adapters, inject faults, and reset the environment.
Platforms
Save platform targets, apply templates, clean up managed resources, and audit runs.
Shell
The header includes documentation, alerts, and account actions.
The sidebar has three groups:
- Navigate: Fleet, Events, Tags, Platforms, Control.
- Catalog: Environments and Models.
- Running: live model groups with counts and per-model health.
The footer shows simulation time, tick number, uptime, and engine state.
Console pages use root paths such as /events, /tags, and /platforms.
Admin API routes stay under /api.
Docker port
Map the admin port when running the image:
docker run --rm -p 1883:1883 -p 8080:8080 amineamaach/miravo:latestThe admin server binds to 127.0.0.1 by default. Expose another interface when needed:
miravo start --admin-host 0.0.0.0Was this page useful?
Last updated on